

mapbox使用,包括绘制、加载、修改、删除点和面,显示弹框等
发布于2022-03-19 03:12 阅读(4190) 评论(0) 点赞(25) 收藏(3)
加载地图数据
mapbox api地址:http://www.mapbox.cn/mapbox-gl-js/api/
mapbox-gl-draw git地址: https://github.com/mapbox/mapbox-gl-draw
一、在index.html全局引入mapbox-gl的js和css包,下载地址https://download.csdn.net/download/weixin_39150852/19348455
由于项目中会涉及到部分空间几何对象关系的计算,需借助turf.js,详细使用方法可参考:https://blog.csdn.net/weixin_39150852/article/details/116758542

二、创建地图组件,初始化地图
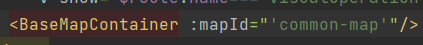
<template>
  <div class="map-wrapper" :id="mapId"></div>
</template>

<script>

var map;
import {updateVisualOperationMapViewer} from "../../store/map/mapService";

export default {
  name: "BaseMapContainer",
  props: {
    mapId: {
      default(){
        return 'map'
      }
    }
  },
  data() {
    return {};
  },
  mounted() {
    this.initMap();
  },
  methods: {
    // 初始化地图
    initMap() {
      map = new mapboxgl.Map({
        container: this.mapId,//地图容器
        style: {
          version: 8,
          glyphs: "/font/{fontstack}/{range}.pbf",//字体文件
          sources: {
            "raster-tiles": {
              type: "raster",
              tiles: [
                "http://t4.tianditu.com/DataServer?T=img_w&x={x}&y={y}&l={z}&tk=4b01c1b56c6bcba2eb9b8e987529c44f",//天地图影像(全球)
              ],
              tileSize: 256,
            },
          },
          layers: [
            {
              id: "simple-tiles",
              type: "raster",
              source: "raster-tiles",
            },
          ],
        },
        center: [103.30400138502898, 29.78955907249347],//初始中心点
        zoom: 15.5,
        minZoom: 9.5,
        pitch: 35, //切斜角度
        bearing: 0, //旋转角度
      });
      updateVisualOperationMapViewer(map);//保存map对象,方便在其他页面使用
      //数据存储具体实现方法可参考Akita的介绍和使用
      //https://blog.csdn.net/weixin_39150852/article/details/109216097

    }
  },
};
</script>
<style lang="less">
.map-wrapper {
  width: 100%;
  height: 100%;
}
</style>

layers的type常用类型
fill: 多边形
line: 线
symbol: 图标或文本标签
circle: 实心圆
heatmap: 热力图
raster:影像(包括高德,arcgic,天地图等)
background: 地图的背景颜色或图案(不需要sources)
sources的type常用类型
vector: 矢量(使用时layer必须指定’source-layer’值)
raster:影像(包括高德,arcgic,天地图等)
geojson:geojson格式数据
image:图像
video: 视频
三、使用地图组件
1、在相应页面引用地图组件
2、创建mapjs
加载多个范围面
import axios from "axios";
import {getVisualOperationMapViewer} from "../../../store/map/mapService";
var map = getVisualOperationMapViewer();//获取map对象

/**
 * 转换数组,获取颜色属性
 */
function arrayGetColor(defaultArray) {
  defaultArray.filter((e) => {
    if (e.properties["功能区type"] == "3") {
      return (e.properties.RGB = "rgba(0, 210, 145, 1)");
    } else if (e.properties["功能区type"] == "4") {
      return (e.properties.RGB = "rgba(171, 255, 80, 1)");
    } else if (e.properties["功能区type"] == "5") {
      return (e.properties.RGB = "rgba(255, 73, 73, 1)");
    } else if (e.properties["功能区type"] == "6") {
      return (e.properties.RGB = "rgba(0, 255, 252, 1)");
    } else if (e.properties["功能区type"] == "7") {
      return (e.properties.RGB = "rgba(255, 247, 132, 1)");
    } else if (e.properties["功能区type"] == "8") {
      return (e.properties.RGB = "rgba(176, 124, 255, 1)");
    } else if (e.properties["功能区type"] == "1") {
      return (e.properties.RGB = "rgba(255, 137, 187, 1)");
    } else {
      return (e.properties.RGB = "rgba(255, 255, 255, 1)");
    }
  });

  return defaultArray;
};

/**
 * 添加功能区
 */
export function addBoundaries() {
    removeBoundaries();
    //加载多个范围面
    axios.get("/json/功能区.json").then((res) => {
        let newArr = res.data;
        newArr.features = arrayGetColor(newArr.features);//设置RGB属性
        // 渲染地图色块图层
        map.addSource("Area_Geojson", {
            type: "geojson",
            data: newArr,
        });
        map.addLayer({
            id: "maine",
            type: "fill",
            source: "Area_Geojson",
            layout: {},
            paint: {
                "fill-color": ["get", "RGB"],//根据不同类型显示不同颜色多边形
                "fill-opacity": 0.5,
            },
            //筛选数据,过滤掉geometry.type非Polygon类型数据
            //filter: ["==", "$type", "Polygon"]
        });
    });
     //为每个范围面设置标注信息
    axios.get("/json/功能区.json").then((res) => {
        res.data.features.forEach(item=>{
            let poly;
            if(item.geometry.coordinates.length>1){
                //解决'Each LinearRing of a Polygon must have 4 or more Positions.'错误
                poly = turf.multiPolygon(item.geometry.coordinates);
            }else{
                poly = turf.polygon(item.geometry.coordinates);
            }
            item.geometry = turf.centerOfMass(poly).geometry; //通过turf获取面得中心点坐标
        })
        let newCenterArr = res.data;
        //渲染地图面标注图层
        map.addSource("Area_Center_Geojson", {
            type: "geojson",
            data: newCenterArr,
        });
        map.addLayer({
            id: "maineCenter",
            type: "symbol",
            source: "Area_Center_Geojson",
            layout: {
                "text-field": ["get", "功能区类别"],
                "text-font": ["Open Sans Semibold,Arial Unicode MS Bold"],//字体文件,对应public/font
                "text-size": 8,
		        "text-ignore-placement": true, //忽略文字的位置
		        "text-allow-overlap": true // 文字允许重叠
            },
            paint: {
                "text-color": "#fff",
            }
        });
    });
}
/**
 * 移除功能区
 */
export function removeBoundaries(){
    // 删除功能区相关地图数据
    if (!map) {
        map = getVisualOperationMapViewer()
    } else {
        let layers = map.getStyle().layers;//获取所有图层
        if (layers.some(value => value.id == "maine")) {
            map.removeLayer("maine");
            map.removeSource("Area_Geojson");
        }
        if (layers.some(value => value.id == "maineCenter")) {
            map.removeLayer("maineCenter");
            map.removeSource("Area_Center_Geojson");
        }
    }
}
newArr数据格式:
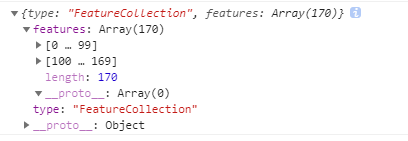

实现效果:在这里插入图片描述

绑定地图事件
/**
 * 地图绑定点击事件
 */
export function mapBingClick() {
  map.on("click", "maine", clickFunctionArea);
  map.on("mouseenter", "maine", changeCursor);
  map.on("mouseleave", "maine", changeCursor);
}
/**
 * 改变鼠标状态
 */
function changeCursor(e){
  if(e.type === "mouseleave"){
    map.getCanvas().style.cursor = "";
  }else if(e.type === "mouseenter"){
    map.getCanvas().style.cursor = "pointer";
  }
}
/**
 * 移除地图绑定点击事件
 */
export function clearMapBingClick(){
  if (!map) {
    map = getVisualOperationMapViewer()
  } else {
    map.off("click", "maine", clickFunctionArea);
    map.off("mouseenter", "maine", changeCursor);
    map.off("mouseleave", "maine", changeCursor);
  }
}
/**
 * 点击功能区
 */
function clickFunctionArea(e){
  if(e.defaultPrevented)return;
  while (Math.abs(e.lngLat.lng - coordinates[0]) > 180) {
       coordinates[0] += e.lngLat.lng > coordinates[0] ? 360 : -360;
  }//防止数据越界
  let areaData = e.features[0];
  //定位至当前点
  map.flyTo({
      center: [e.lngLat.lng, e.lngLat.lat],
      zoom: 16, //目标层级
      duration: 800, //飞行总时长,单位ms
    });
    //高亮当前图层
    let sources = map.getStyle().sources;
    let sourceArea = sources['Area_Geojson'].data;
    sourceArea.features = arrayGetColor(sourceArea.features);//恢复初始
    sourceArea.features.forEach(item => {
      if (item.properties['Field_smid'] === areaData.properties['Field_smid']) {
        item.properties.RGB = "#29f";//设置高亮颜色
      }
    })
    map.getSource('Area_Geojson').setData(
        sourceArea
    );
  // 阻止事件冒泡
  e.preventDefault();
}
加载多个点
1、通过addLayer加载,点击事件map.on("click", "points", clickFunctionArea);
/**
 * 加载树木
 */
function addPoint(type) {
  let layers = map.getStyle().layers;
  // 获取图层,若存在该图层,exist为true,反之false
  let exist = layers.some(value => value.id == "points");
  // 判断是否存在该图层,若存在,先删除图层
  if (exist) {
    map.removeLayer("points");
    map.removeSource("pointGeoJson");
    map.removeImage("pointImg");
  }
  /**
   * 拉取点位数据
   */
   axios.get("/json/树木.json").then((res) => {
        let newArr = res.data;
        map.loadImage("/img/树木.png", function(error, image) {
	    if (error) throw error;
	    map.addImage("pointImg", image);

	    map.addSource("pointGeoJson", {
	      type: "geojson",
	      data: {
	        type: "FeatureCollection",
	        features: newArr,
	      },
	    });

	    map.addLayer({
	      id: "points",
	      type: "symbol",
	      source: "pointGeoJson",
	      layout: {
	        "icon-image": "pointImg",
	        "icon-size": 0.6,
	        "icon-offset": [0, -19],
	        "icon-ignore-placement": true, //图标忽略位置(本图层时可重叠)
	        "icon-allow-overlap": true, // 图标允许重叠(多图层时可重叠)
	        "text-field": ["get", "mapInfoName"],//显示mapInfoName内容
	        "text-offset": [0, -3.5],
	        "text-font": ["Open Sans Semibold,Arial Unicode MS Bold"],
	        "text-size": 14,
	        "text-ignore-placement": true, //文本忽略位置
	        "text-allow-overlap": true, //文本允许重叠
	        // 点位过多,地图缩放时,重叠在一起的点位会隐藏,
	        // 此处点位渲染了“text”和“icon”,必须同时设置“text”和"icon"的忽略位置属性,单独设置不生效
	      },
	      paint: {
	        "text-color": "#d1d1d1",
	      },
	    });
	  });
    });
}
newArr 数据格式:

实现效果:

2.通过marker加载(不建议使用,二次进入加载时功能区面不显示颜色,其他功能全部正常,目前暂未找到原因)
/**
 * 加载树木
 */

var facilityMapMarkers = [];//地图加载的所有点
var facilityMapMarkersText = [];//地图加载的所有点标注
export function drawFacilityMarker(data, type = '') {
    //标记点击事件
    function handleKitten(e) {
        e.stopPropagation();
        const target = e.target || e.srcElement;
        if ( target.getAttribute("dataId")) {

        }
    }
    axios.get("/json/树木.json").then((res) => {
       	//初始化加载点数据
        res.data.forEach(data=> {
            let coordinate = [Number(data.facilityLongitude), Number(data.facilityLatitude)];
		    let el = document.createElement("div");
		    el.style.backgroundImage = "url(/img/基础设施.png)";
		    el.style.backgroundSize = "100% auto";
		    el.style.width = 30 + "px";
		    el.style.height = 38 + "px";
		    el.setAttribute("dataId", data.id);//设置id
		    let marker = new mapboxgl.Marker(el)
		        .setLngLat(coordinate)
		        .setOffset([0, -19])
		        .addTo(map);
		    facilityMapMarkers.push(marker);
		    el.addEventListener("click", handleKitten, false);
		    //加载点注释
		    drawFacilityMarkerText(data)
}
/**
 * 加载点注释
 */
function drawFacilityMarkerText(data){
    let coordinate = [Number(data.facilityLongitude), Number(data.facilityLatitude)];
    let text = facilityMarkerData.find(item => item.id === data.id)
    let el = document.createElement("div");
    el.style.fontSize = '16px';
    el.innerHTML = text ? text.facilityName : '';//修改点注释可通过获取当前dom,改变innerHTML值
    let markerText = new mapboxgl.Marker(el)
        .setLngLat(coordinate)
        .setOffset([0, -50])
        .addTo(map);
    facilityMapMarkersText.push(markerText)
}
/**
 * 移除点数据
 */
export function removeFacilityMarker() {
    facilityMapMarkers.forEach(item => {
        item.remove();
    })
    facilityMapMarkersText.forEach(item => {
        item.remove();
    })
}

实现效果:
修改图层显示状态
/**
 * 改变图层显示状态
 */
export function showLayers(id, show) {
 	let layers = map.getStyle().layers;
    if (layers.some((value) => value.id === id)) {
      map.setLayoutProperty(id, 'visibility', show ? 'visible' : 'none');
    }
}
修改图层数据以实现地图界面的增删改
/**
 * 改变地图状态(地图数据)
 */
export function changeSource(data, type) {
    let sources = map.getStyle().sources;
    if (type === 'edit') {
        if (data.geometry.type === 'Polygon') {//修改面标注内容
            let sourceAreaCenter = sources['planAreaCenter'].data;
            sourceAreaCenter.features.forEach(item => {
                if (item.properties['id'] === data['id']) {
                    item.properties.mapInfoName = data.name
                }
            })
            map.getSource('planAreaCenter').setData(
                sourceAreaCenter
            );
        } else if (data.geometry.type === 'Point') {//修改点标注内容
            let sourcePoint = sources['planPoint'].data;
            sourcePoint.features.forEach(item => {
                if (item.properties['id'] === data['id']) {
                    item.properties.mapInfoName = data.name
                }
            })
            map.getSource('planPoint').setData(
                sourcePoint
            );
        }
    } else if (type === 'delete') {
        let sources = map.getStyle().sources;
        if (data.geometry.type === 'Polygon') {
            let sourceArea = sources['planArea'].data;
             //删除面数据
            sourceArea.features = sourceArea.features.filter(item => item.properties['id'] !== data['id']);
            map.getSource('planArea').setData(
                sourceArea
            );
            //删除面标注
            let sourceAreaCenetr = sources['planAreaCenter'].data;
            sourceAreaCenetr.features = sourceAreaCenetr.features.filter(item => item.properties['id'] !== data['id']);
            map.getSource('planAreaCenter').setData(
                sourceAreaCenetr
            );
        } else if (data.geometry.type === 'Point') {
            let sourcePoint = sources['planPoint'].data;
             //删除点数据
            sourcePoint.features = sourcePoint.features.filter(item => item.properties['id'] !== data['id']);
            map.getSource('planPoint').setData(
                sourcePoint
            );
        }
    }
}
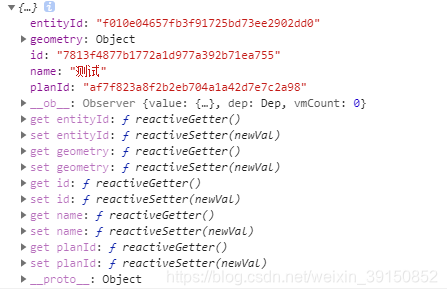
数据格式:
显示地图弹框
- 定义弹框组件
<template>
  <div class="operateform_box" id="operateForm">
    <p class="title_box">基础设施
      <span class="title-close" @click="onClose"><i class="el-icon-close"></i></span>
    </p>
    <div class="content_box">
      <el-form
          ref="infrastructureForm"
          :model="formdata"
          label-width="80px"
          size="mini"
      >
        <el-form-item
            label="设施名称"
            prop="name"
            :rules="[
            { required: true, message: '请输入设施名称', trigger: 'blur' },
          ]"
        >
          <el-input v-model="formdata.name" maxlength="30"></el-input>
        </el-form-item>
      </el-form>
      <div style="width:100%; display: flex;justify-content: flex-end;">
        <el-button @click="onClose" size="mini">取消</el-button>
        <el-button @click="onSubmit" size="mini">保存</el-button>
      </div>
    </div>
  </div>
</template>

<script>
import {removeFacilityPopup} from "../mapjs/InfrastructureMap";

export default {
  name: "OperateForm",
  props: {
    facilityData: {
      default() {
        return {}
      }
    }
  },
  data() {
    return {
      formdata: {
        name: "",
      },
    };
  },
  mounted() {
    if(this.facilityData.id){
      this.formdata.name = this.facilityData.facilityName;
    }
  },
  methods: {
    onSubmit() {
      this.$refs["infrastructureForm"].validate((valid) => {
        if (valid) {

        }
      });
    },
    onClose(){
      removeFacilityPopup()
    }
  },
};
</script>

<style lang="less" scoped>
.operateform_box {
  border: 1px solidrgba(48, 214, 255, 0.77);
  background: rgba(1, 10, 13, 0.6);
  padding: 15px;
  box-sizing: border-box;

  .title_box {
    height: 30px;
    font-size: 14px;
    color: #ffffff;
    position: relative;
    .title-close{
      position: absolute;
      right: 0;
      top: 0;
      color: #999;
      cursor: pointer;
      font-size: 20px;
    }
  }


  .content_box {
    display: inline-block;
  }
}
</style>
- 修改mapbox弹框默认样式
 //地图弹框设置背景透明
.mapboxgl-popup-content {
  background: transparent;
}
.mapboxgl-popup-tip {
  display: none;
}
- 在mapjs中引用弹框组件
import Vue from "vue";
import OperateForm from "../dialog/OperateForm.vue";
const MapFacilityPopupComponent = Vue.extend(OperateForm);
var facilityMapPopup, popupData;
/**
 * 显示弹框
 */
function showFacilityPopup(data) {
    popupData = data;
    removeFacilityPopup();
    // 加载基础设施弹框
    let popupHTML = '<div id="popup-box"></div>';
    let coordinate = [Number(data.facilityLongitude), Number(data.facilityLatitude)];
    facilityMapPopup = new mapboxgl.Popup({
        closeButton: false,
        closeOnClick: false,
        offset: [0, -10],
    })
        .setLngLat(coordinate)
        .setHTML(popupHTML)
        .setMaxWidth("none")
        .addTo(map);
    new MapFacilityPopupComponent({
        propsData: {
            facilityData: data,
        }
    }).$mount("#popup-box");
}
/**
 * 移除弹框
 */
export function removeFacilityPopup() {
    if (facilityMapPopup) {
        facilityMapPopup.remove();
        facilityMapPopup = null;
    }
}
数据格式:
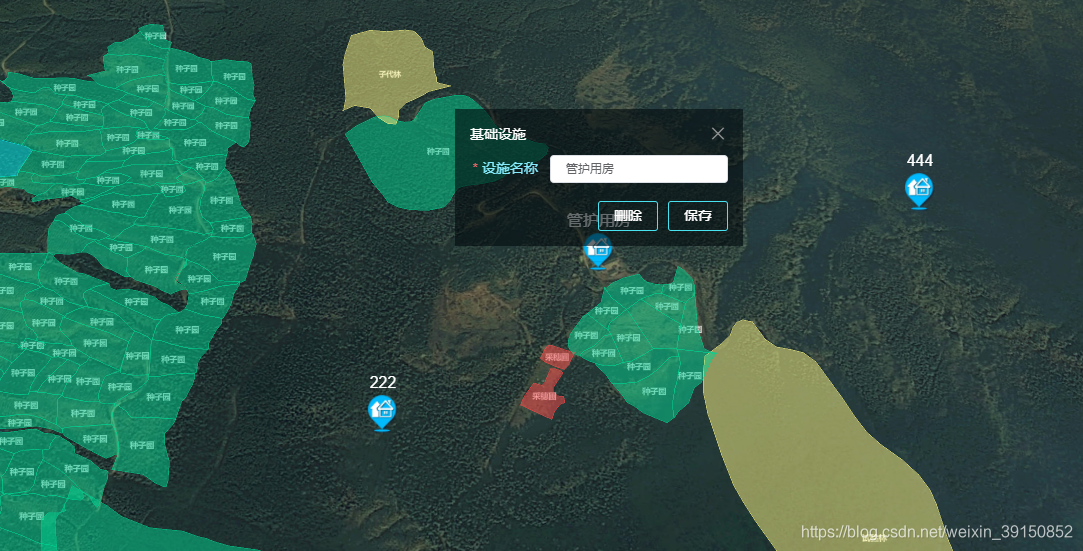
 实现效果:
实现效果:
定位至某个面
/**
 * 计算一个最大值和最小值
 */
function getPolygonBoundingBox(feature) {
  // bounds [xMin, yMin][xMax, yMax]
  var bounds = [[], []];
  var polygon;
  var latitude;
  var longitude;

  for (var i = 0; i < feature.geometry.coordinates.length; i++) {
    if (feature.geometry.coordinates.length === 1) {
      // Polygon coordinates[0][nodes]
      polygon = feature.geometry.coordinates[0];
    } else {
      // Polygon coordinates[poly][0][nodes]
      polygon = feature.geometry.coordinates[i][0];
    }

    for (var j = 0; j < polygon.length; j++) {
      longitude = polygon[j][0];
      latitude = polygon[j][1];

      bounds[0][0] = bounds[0][0] < longitude ? bounds[0][0] : longitude;
      bounds[1][0] = bounds[1][0] > longitude ? bounds[1][0] : longitude;
      bounds[0][1] = bounds[0][1] < latitude ? bounds[0][1] : latitude;
      bounds[1][1] = bounds[1][1] > latitude ? bounds[1][1] : latitude;
    }
  }

  return bounds;
}
   map.off("click", "maine", (e)=>{
   		let boundingBox = getPolygonBoundingBox(e.features[0]);
    	map.fitBounds(boundingBox, { padding: 100});//在指定的地理边界内平移和缩放地图,以包含其可见区域。padding:距离边界的填充量
   });
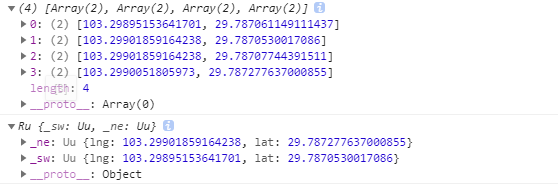
e.features[0] 和 boundingBox 数据结构:

实现效果:

定位至某条线
    let coordinates = e.features[0].geometry.coordinates.slice();//slice返回一个数组
    let bounds = coordinates.reduce(function (bounds, coord) {
      return bounds.extend(coord);
    }, new mapboxgl.LngLatBounds(coordinates[0], coordinates[0]));

    map.fitBounds(bounds, {
      padding: 20
    });
数据格式:
定位至某个点
   map.flyTo({
      center: [e.lngLat.lng, e.lngLat.lat],
      zoom: 16, //目标层级
      duration: 800, //飞行总时长,单位ms
    })
绘制图形
一、在index.html全局引入mapbox-gl-draw的js和css,参考上诉mapbox-gl的引用
二、在初始化地图时初始化draw
	draw = new MapboxDraw({
        displayControlsDefault: false,//是否显示默认的地图控件
	    controls: {//显示的地图控件,自定义控件时不设置
	        polygon: true,
	        line_string:true,
	        point:true,
	        trash: true
	    }
      });
      updateMapDraw(draw);//保存draw对象,方便在其他页面使用
三、在mapjs中监听绘制状态
map.addControl(draw, "top-left");   //控件显示位置
map.on('draw.create', updateArea);
map.on('draw.delete', updateArea);
map.on('draw.update', updateArea);
export function updateArea(e) {
    if (e.type === 'draw.create') {
    //图形绘制完成
    }else if(e.type === 'draw.update'){
    //修改绘制图形后
    }else if(e.type === 'draw.delete'){
    //删除绘制图形
    }
实现效果:

自定义控件,删除controls,在相应页面定义按钮,实现绘制类型的切换
<div class="map-btn">
     <el-button @click="changeDrawModel('draw_point')" class="audit-btn" size="mini">绘点</el-button>
     <el-button @click="changeDrawModel('draw_polygon')" class="audit-btn" size="mini">绘面</el-button>
</div>

/**
 * 改变绘制类型
 */
export function changeDrawModel(type) {
    draw.changeMode(type);
}
自定义绘制时显示的点图标或图形样式
在初始化draw时,修改style
	  map.loadImage("/img/marker.png", function (error, image) {
        if (error) throw error;
        map.addImage("pointImg", image);
      });
      draw = new MapboxDraw({
        displayControlsDefault: false,
        styles: [
          //绘制点图标
          {
            'id': 'points-are-blue',
            'type': 'symbol',
            'filter': ['all',
              ['==', '$type', 'Point'],
              ['==', 'meta', 'feature'],
              ['==', 'active', 'false']],
            'layout': {//设置绘制后显示的点图标
              "icon-image": "pointImg",
              "icon-size": 1,
              "icon-offset": [0, -15],
              "icon-ignore-placement": true, //图标忽略位置
            },
            'paint' : {
              "text-color": "#fff",
            }
          },
          {
            'id': 'highlight-active-points',
            'type': 'symbol',
            'filter': ['all',
              ['==', '$type', 'Point'],
              ['==', 'meta', 'feature'],
              ['==', 'active', 'true']],
            'layout': {//设置点激活状态下显示的图标
              "icon-image": "pointImg",
              "icon-size": 1,
              "icon-offset": [0, -15],
              "icon-ignore-placement": true, //图标忽略位置
            },
            'paint' : {
              "text-color": "#fff",
            }
          },
          // 设置面样式
          {
            "id": "gl-draw-polygon-fill",
            "type": "fill",
            "filter": ["all",
              ["==", "$type", "Polygon"],
              ["!=", "mode", "static"]],
            "paint": {//设置绘制面时显示的填充颜色及透明度
              "fill-color": "#D20C0C",
              "fill-outline-color": "#D20C0C",
              "fill-opacity": 0.1
            }
          },
          {
            "id": "gl-draw-polygon-stroke-active",
            "type": "line",
            "filter": ["all", ["==", "$type", "Polygon"], ["!=", "mode", "static"]],
            "layout": {
              "line-cap": "round",
              "line-join": "round"
            },
            "paint": {//设置绘制面时显示的描边颜色、线条类型、宽度
              "line-color": "#fbb03b",
              "line-dasharray": [0.2, 2],
              "line-width": 2
            }
          },
          {
            "id": "gl-draw-polygon-and-line-vertex-halo-active",
            "type": "circle",
            "filter": ["all", ["==", "meta", "vertex"], ["==", "$type", "Point"], ["!=", "mode", "static"]],
            "paint": {//设置绘制面时显示的转折点的大小,边框颜色
              "circle-radius": 5,
              "circle-color": "#fff"
            }
          },
          {
            "id": "gl-draw-polygon-and-line-vertex-active",
            "type": "circle",
            "filter": ["all", ["==", "meta", "vertex"], ["==", "$type", "Point"], ["!=", "mode", "static"]],
            "paint": {//设置绘制面时显示的转折点的大小,填充颜色
              "circle-radius": 3,
              "circle-color": "#705080",
            }
          }
        ]
      });
实现效果


Mapbox常用表达式:
https://blog.csdn.net/hequhecong10857/article/details/115425431
draw常用方法:
https://blog.csdn.net/u011435933/article/details/104778290
原文链接:https://blog.csdn.net/weixin_39150852/article/details/117410270
所属网站分类: 技术文章 > 博客
作者:西小口到了吗
链接:http://www.qianduanheidong.com/blog/article/319168/0c0b4877e8b1f0d0cca5/
来源:前端黑洞网
任何形式的转载都请注明出处,如有侵权 一经发现 必将追究其法律责任
昵称:
评论内容:(最多支持255个字符)
---无人问津也好,技不如人也罢,你都要试着安静下来,去做自己该做的事,而不是让内心的烦躁、焦虑,坏掉你本来就不多的热情和定力